It’s been one year since the Linguistic Data Subcommunity held its first cross-public sector meeting, having run for more than a year within the Office for National Statistics (ONS). In this post, I’ll give a bit of background on our first year and provide some thoughts for people looking to set up their own Community as well as to Senior Leaders on the value of these networks.
Background
The Linguistic Data Subcommunity started within the then Methodology Division in the ONS. Several of us were using Natural Language Processing (NLP) methods for various projects and set up a regular catch-up meeting to discuss progress and blocks and share experiences. This fortnightly meeting expanded to around 20 people from different ONS Divisions and I approached the Data Science Community to ensure we were aligned with more cross-cutting work. Having seen interest across government, the Data Science Community Manager promoted the group to a wider audience. I changed the name to the Text Data Subcommunity to reflect a broader approach to collection, management, and interpretation of text data rather than purely focusing on the NLP methods. At the end of 2023, the Subcommunity agreed to change names again to include emerging interest in analysing audio and hand-written image data. Currently, we cover anything to do with analyses involving language.
What did we achieve in our first year?
Membership and meeting attendance
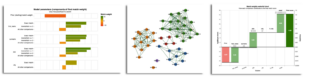
Membership went viral early in 2023, going from 20 members to 100 in our first two months. At time of writing we have 249 members. Of those, we have an average attendance of 58 people at the 27 meetings we’ve held.
A surprising turn of events was that entire teams would request to join. While not all team members might attend regularly, this behaviour points to staff finding value in the community enough to recommend us to their colleagues.
Another noteworthy occurrence is members notifying us of changes to their email address as they move roles around public sector. For a voluntary community of practice, this level of engagement, where members go out of their way to ask us to update their details, shows how valuable they find the meetings.
Meetings
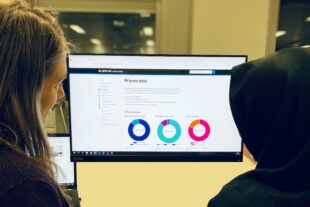
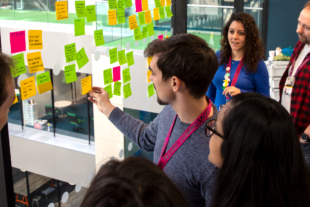
Meetings have been run fortnightly for an hour since late January 2023. The meetings are mostly project show & tells or strategic discussions on topics like methodological deep dives, data maturity and the potential risks of AI. We’ve also had several discussions on skills and development, including with the Data Science Campus Capability Building Team who are using these to extend their existing NLP Learning Pathway. We do peer review or testing, for example a crackathon of the ONS’ StatsChat chatbot, but are increasingly being asked to review project proposals and follow-on updates to ensure best practice throughout a project lifecycle. This is very heartening as it shows both a commitment to quality and that the Subcommunity is seen as a supportive space where people can bring their ideas rather than somewhere people can only present “perfect” completed projects.
External presentations
Members of the Subcommunity took part in many of the DataConnect23 events, with four of the five NLP events involving members and the Subcommunity led a panel discussion on text data maturity. We had a panel discussion at the Data Science Community Showcase on NLP skills that had more than 200 attendees.
Members also took part in discussions and presentations at the Royal Statistical Society Conference, for a panel on evaluating AI, and other cross-public sector events such as the Home Office Data & Information Week where we presented on the role of the Humanities in analysis.
Impact
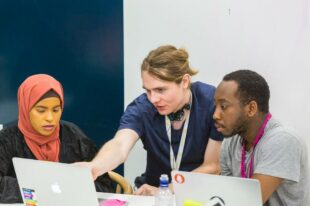
Having a central point of contact for anything related to linguistic data means that analysts and senior leaders can more easily find people or projects. We provided information to an ONS review on automation and provided ONS with a list of cross-public sector Large Language Model (LLM) projects to help them streamline their LLM project proposals by identifying areas that have already been researched. We’ve also helped numerous ad hoc requests for specialist skills from analysts across public sector through the Slack channel.
As well as technical support, the Subcommunity has helped other communities of practice by sharing knowledge and experience of running large and engaged networks and by trialling different presentation and management methods. We are part of the Data Science Community Working Group as well as being part of several other Subcommunities and their management groups as well as supporting the Department for Science, Innovation and Technology in establishing their communities of practice. Our advice on creating a supportive and empowering space for members has been adopted across multiple communities.
Feedback
Feedback from members has been that show & tells have been “inspiring” and discussions are “great” and “really interesting”. Members have expressed appreciation at the focus on quality and alignment with strategic objectives as it helps them argue for increased resources.
What didn’t go so well?
Mostly, not much. It’s all going great so far.
If I were to do it again, I’d have a central committee set up from the start. With great responsibility comes, well, great responsibility and, as much as I enjoy engaging the Community in activities I think are important, it’s tiring always being the sole chair and having to find and organise potential speakers (and worry if they have to reschedule). I’ve encouraged members to chair but no one’s taken me up on it so far. I would love to hear from anyone with an interest in joining me on this journey.

What do we want to do next?
There were a few things we didn’t get time to do in our first year and some other things that have emerged since we started.
- Git repo: We have one but it’s empty and we don’t know how best to use it. We need to agree if we’re going to keep it and, if so, what we want to use it for.
- Themed meetings:
- Academic events: In the original NLP Working Group, we had two presenters from academia who led discussions on more theoretical aspects of linguistic data. These were both extremely well attended with a very engaged wider audience. We have some academic contacts who we are in discussion with for a quarterly series of discussions.
- Best practice and reproducibility: We have arranged discussion events from the Office for Statistics Regulation (OSR) and by the Data Quality Hub, and are in discussion with the Analytical Systems and Pipelines Hub on a training series on reproducible coding.
- Voluntary Application of the Code of Practice for Statistics: The Code of Practice for Statistics are guidelines for public sector that define three principles of trustworthiness, quality and value that statistics should abide by. While the Code is required for official statistical outputs, their use by Communities of Practice and similar networks are voluntary. But applying them would provide structure to our discussions and events, thus further strengthening the culture of best practice.
Get involved
If you would like to join the Linguistic Data Subcommunity, please reach out to Karen.
]]>