Google Analytics
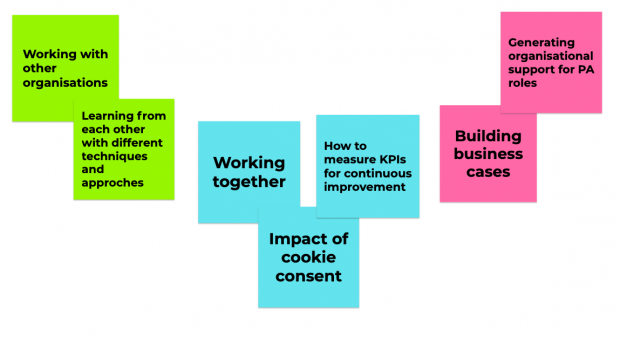
We recently held our first virtual cross-government Performance Analyst Community of Practice meet-up. Clare and Olivia review the event and share what’s next for the community.
Gemma Elsworth, Head of Digital Performance Analytics at DWP, looks back on the challenges and achievements of her first 6 months in the role.
What is the best way to implement Google Analytics (GA) on Department for Work and Pensions (DWP) services? As DWP digital performance analysts, that is the question we asked ourselves last year, after realising that different services were often tagged …
I recently wrote about iterating the way we share data when the user needs of the teams we work with change. A quick recap. As digital performance analysts we’ve got lots of ways of sharing data: daily reports, weekly reports …
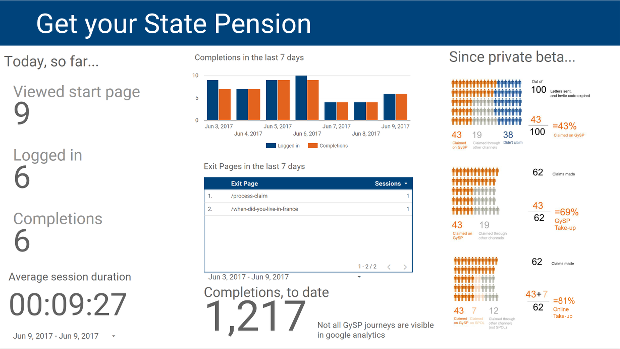
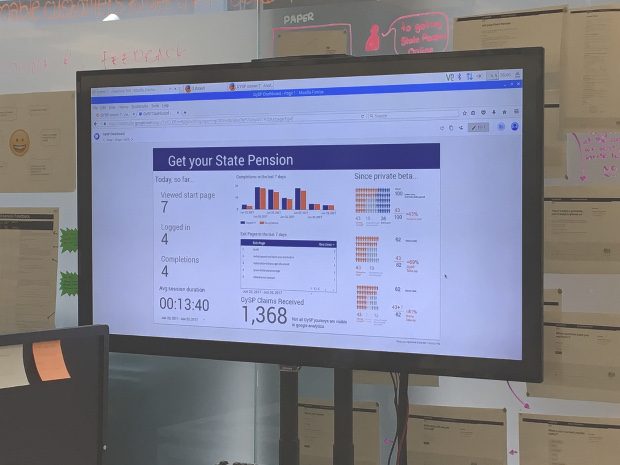
I’m Catherine Hope and I lead the team of Digital Performance Analysts working in Newcastle on the DWP’s retirement provision services. I’m also the DWP’s Data Presentation Champion, and get very excited by charts! I’m going to tell you about …
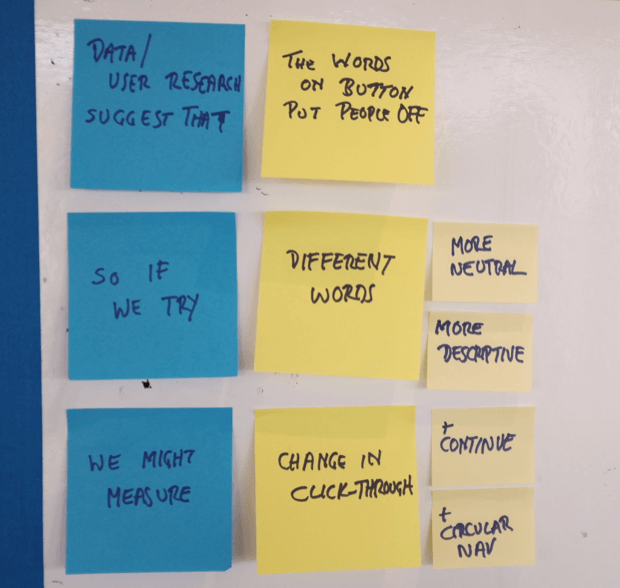
I'm posting a link to Tim Leighton-Boyce's recent post on the Inside GOV.UK blog. It's an excellent example of engaging the whole agile team with data, and working closely with user researchers to validate that behaviours observed in usability testing are demonstrated at …
I wanted to analyse when some GOV.UK foreign language content had last had a content update. I regularly use Google sheets for my analysis, and so use the DETECTLANGUAGE function within sheets to audit our pages without having to worry …
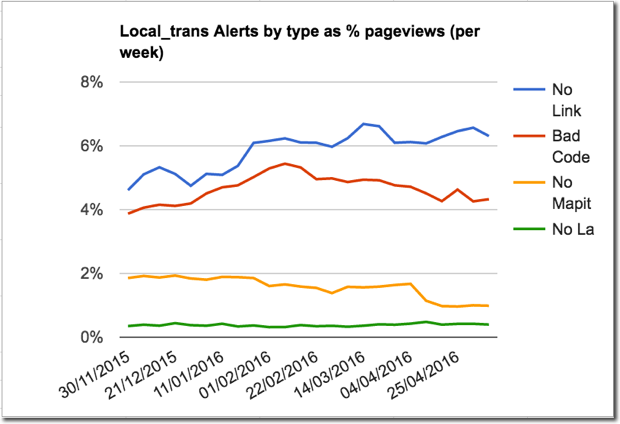
We’re familiar with the value of digital analytics to understand how users interact with websites and digital services, but the data can also produce practical operational information which would be hard to get any other way. We added Google Analytics …
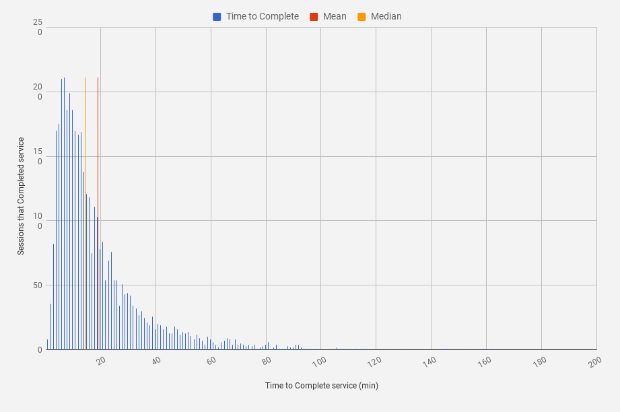
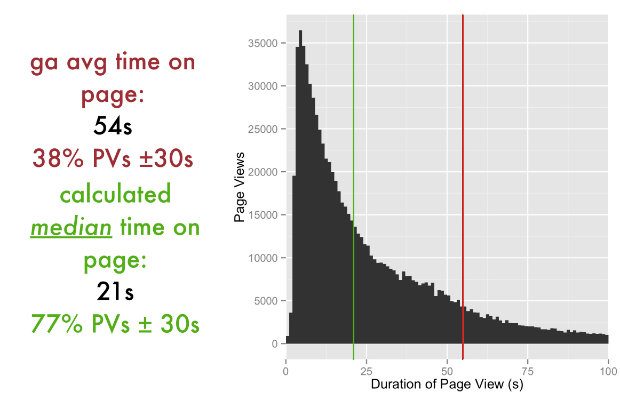
Google Analytics’s Average Time on Page can be a hugely important metric but also a very misleading one. As a mean average, it can be influenced by a skewed distribution, a problem that you can’t diagnose in the web interface. So I found a way to break down the data into individual visit lengths.
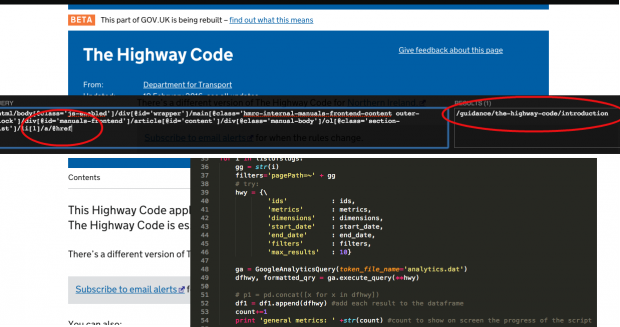
A year and a half ago, two GDS Designers asked me, “Can you show us how Highway Code content on the GOV.UK site is performing?” This would have been a simple request, were it not for the sheer number of pages …