
The Data Science Accelerator - now in its third year - is a capability-building programme which gives analysts from across the public sector the opportunity to develop their data science skills by delivering a project of real business value. The Accelerator runs every four months and applications for the next round will open at the start of September 2017.
We wanted to share what our participants have worked on during the programme and how they’ve applied their data science skills. Here’s an update from our recently graduated 8th Accelerator cohort.
How Data Science Can Help User Research
Kieron Kirkland from GDS wanted to understand how Natural Language Processing could support user research. User Researchers deal with vast amounts of qualitative data, but it’s challenging to track themes that emerge over time and across programmes. There is also a risk of people introducing bias into the process of data analysis, something that automated theme extraction could potentially counter. The output from this project - a model that can analyse key topics from a set of user research interviews - has already attracted a lot of interest from the user research community in government.
Understanding Doctor Recidivism
Tom Franklin from the General Medical Council undertook a project which aimed to understand the factors driving repeat complaints against doctors, and to identify characteristics which might indicate a future risk of harm to patients. Tom developed predictive models using machine learning and visualisation techniques. He then created a report using R Markdown, and a Shiny app which helps users understand the outputs from the models. The GMC is now undertaking further analysis of Tom’s findings.
Analysis and Visualisation of Vessel Monitoring Data
Lisa Richardson from the Marine Management Organisation (MMO) wanted to simplify the process of analysing vessel satellite data. Using packages in R, she created an interactive app which visualises data and allows colleagues to extract data defined to their specification. Users can choose desired sea areas, species of interest, vessel lengths, gear and activity. Next steps for this work will include conducting further data checks and finding ways of handling large scale datasets.
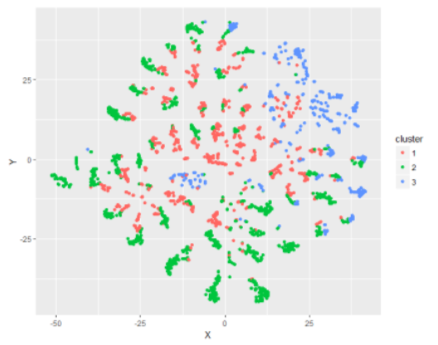
Investment in the School Estate
The problem posed by Andrew Rosser from the Department for Education was how to identify schools with different maintenance issues for improved decision making. Using data from bid based programmes and condition allocations, he identified characteristics of schools correlated with capital funding levels and looked at clustering (such as the PAM algorithm) to explain different investment patterns. The findings from this work are being shared with policy experts at DfE.
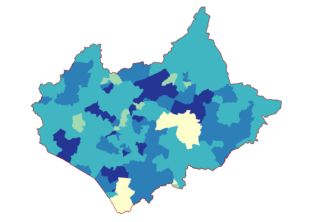
Pharmacy Profiles
Nadine Morrisroe from the NHS Business Services Authority (NHSBSA) sought to develop an interactive online tool which would provide insight about pharmacy contractor activity. The dashboard, built in R Shiny, provides a range of metrics which can be filtered by aspects such as time period, contractor type, region and area. It also includes an interactive map, identifies unusual behaviour on given metrics and allows the user to download data. The quality of the dashboard has encouraged the NHSBSA to train other members of staff in using R Shiny and to invest in Shiny Server, allowing dashboards to be shared online.
Using data science to understand People Survey comments
Every year the Civil Service People Survey goes out to over 400,000 Civil Servants and is a key tool in understanding employee engagement. As part of this we receive open text comments from Civil Servants, however given the volume of responses it’s challenging to analyse the underlying themes at a Civil Service wide level. Leena Phillips from the Cabinet Office undertook a project to see whether data science could be used to identify themes in open text comments, in order to facilitate more targeted action. This was achieved through methods such as LDA to analyse the open text responses, and R shiny to create an interactive visualisation showing the results.
Soldier Load Visualisation
Chris Chin from the Ministry of Defence built a visualisation of how soldiers are affected by different equipment loads. 50 kg is a standard load for a dismounted soldier; optimising the distribution of equipment according to the physical measurements of individuals could reduce the impact of the load and help prevent injuries. Chris created a 2-D representation using a dataset of military personnel body dimensions and used this to create centre of gravities for a range of activities. He will continue to enhance the model using a more comprehensive dataset.
Predicting the Presence of Smoke Alarms in Households
Hiren Patel from Leicestershire Fire & Rescue wanted to identify features likely to result in homes not having smoke alarms, and use this data to prioritise home fire safety checks. With only 2.5% of households likely to get a visit in any one year, it’s important that people most at risk can be prioritised above others. The method involved enriching an internal dataset with features such as household income, tenure and deprivation; and running a random forest model in R. The resulting model has a prioritised feature set, probability score for each home and an overall accuracy rate of 68%.
Better Regulation and Knowledge Management
Leath Al Obaidi from Ofgem explored ways to create a database of Ofgem’s publication library, providing clearer oversight for the Better Regulation and Knowledge Management team and highlighting opportunities to streamline similar pieces of guidance created by different teams. The current procedure is a time consuming process with a short turnaround time, which would greatly benefit from automation. Using R, Leath downloaded Ofgem’s entire publication list including pdf documents. Leath is continuing his work on this project, using natural language processing and a term document matrix to numerically represent the text, and latent dirichlet analysis to group topics.
Historic Trend Analysis Analytics Tool
Adam Thiery from the Ministry of Defence wanted to find a way to make it easier to find specific datasets, allowing time to be spent on analysis rather than searching for data. After applying normalisation techniques to a representative set of historical engineering and cost data, Adam was able to perform comparisons and analysis which reflected current economic conditions. He is now developing a front end dashboard using VBA, which uses machine learning algorithms and historic trend analysis of existing values to populate data gaps.
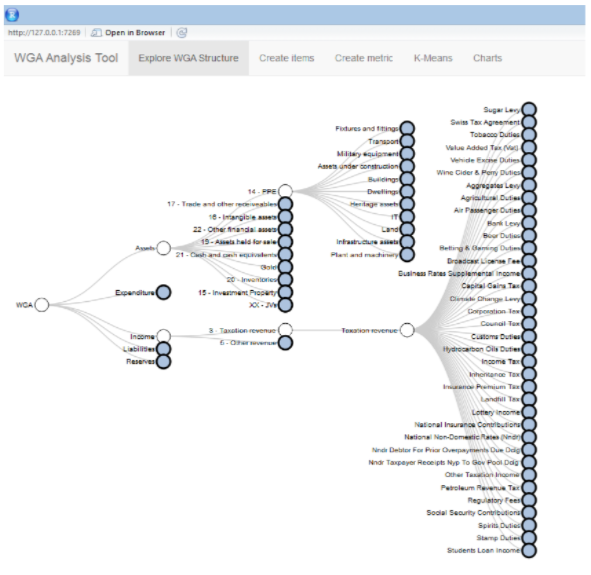
Local Government Accounts Analysis
Robindra Neogi from the National Audit Office developed a tool to interact with the Whole of Government Accounts data - a consolidated set of financial statements for the UK public sector. The aim of the tool is to process data into meaningful metrics to help understand the financial sustainability of the Local Government sector. The tool (built in Shiny) provides an interface for creating custom metrics, produces a selection of descriptive statistics and charts, and groups Local Authorities into similar clusters using K-means.
Ports of Refuge
Mike Green from the UK Hydrographic Office aimed to identify ‘ports of refuge’ where ships can shelter from bad weather. Automatic Identification System (AIS) and meteorological data were used to analyse the relationship between navigational behaviour and prevailing weather. As it was difficult to find open offshore weather, data Mike used data from the National Hurricane Centre to create parameters, and principal component analysis to identify deviations in shipping route patterns during hurricanes. Next steps for this project include developing a machine learning function to identify the location of other ports of refuge.
Employment Outcomes for Young People with Special Educational Needs
Gemma Coleman from Department for Education assessed the impact of recent reforms to Special Educational Needs (SEN) support, particularly in terms of employment prospects. The Longitudinal Educational Outcomes dataset was used to conduct visual data exploration, comparing the employment outcomes for young people with or without SEN. Gemma then built a decision tree which identified important insights; such as GCSE results being the most important predictor of employment, ahead of other factors such as gender and type of school (special or mainstream).
How do Components of Non-Domestic Properties Contribute to their Value?
Sarah Blake from the Valuation Office Agency aimed to look at whether the adjustments that are currently applied to different components of non-domestic properties when calculating their Rateable Value are accurately reflected in the rents paid for them. Using the Pandas library in Python, the data was transformed into a format suitable for analysis. Then, focusing on shops, Sarah used R to model Rateable Values and extract the size of the adjustments made to each component of the property. Next steps will include developing models for other property types such as offices.
Risk Assessment for Falls
David Martin from NHS Wales sought to develop a way in which patients could be automatically assessed for the likelihood of them having a fall whilst staying in hospital. By conducting an automatic multifactorial risk assessment a patient could be assessed based on factors such as demographics, treatment history, previous admissions, medication, visual and other sensory impairments. This model produced by David will help front line staff move away from the current manual (and time-consuming) process of fall risk assessment and instead focus the necessary resources onto the patients who are at most risk.
For more information on the Accelerator programme please see our guidance page or email us at data-science-accelerator@digital.cabinet-office.gov.uk.