Producing official statistics for publications is a key function of many teams across government. It’s a time consuming and meticulous process to ensure that statistics are accurate and timely. With open source software becoming more widely used, there’s now a range of tools and techniques that can be used to reduce production time, whilst maintaining and even improving the quality of the publications. This post is about these techniques: what they are, and how we can use them.
The current statistics production process
The process for official statistics production in Government varies widely across departments. The short description here is not definitive, but processes often have some or all of the following steps:
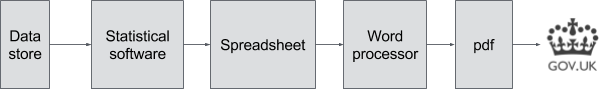
Broadly speaking, data are extracted from a datastore (whether it is a data lake, database, spreadsheet, or flat file), and are manipulated in a proprietary statistical software package, and possibly in proprietary spreadsheet software. Formatted tables are often then ‘copy and pasted’ into a word processor, before being converted to pdf format, and finally published to GOV.UK. This is quite a simplification, as statistical publications are usually produced by several people, so this process is likely to be happening in parallel many times.
A key element in this process is quality assurance (QA). Each publication is meticulously checked to ensure the accuracy of the statistics being produced. This may take place throughout the production process or at the end prior to publication. Traditionally, QA has been a manual process which can take up a significant portion of the overall production time of a publication, as any changes will require the manual process of production to be repeated.
A Reproducible Analytical Pipeline
Towards the end of 2016 we embarked on a project with a team in the Department for Culture, Media, and Sport (DCMS) who are responsible for the production of the Economic Estimates for DCMS Sectors Statistical First Release (SFR). Currently this publication is produced with a mix of manual and semi-manual processes. Our aim was to see if we could speed up production of the SFR, whilst maintaining the high standard of the publication and QA.
By using open source tools, and a range of techniques from fields such as reproducible research, software engineering, and DevOps, we recreated part of a statistical release so that it can be easily reproduced, tested, and audited. We’ve called this a ‘Reproducible Analytical Pipeline’ - the emphasis being on ‘Reproducible’: at any point in the future we should be able to look back at this work and be able to reproduce everything that we have done today - something that is difficult with manual/semi-manual processes.
At any point in the future we should be able to look back at this work and be able to reproduce everything that we have done today - something that is difficult with manual/semi-manual processes.
The key elements of the pipeline are explained in the following sections.
Open source rather than proprietary
Open source languages such as Python and R are increasing in popularity across government. One advantage of using these tools is that we can reduce the number of steps where the data needs to be moved from one program (or format) into another. This is in line with the principle of reproducibility given in guidance on producing quality analysis for government (the AQUA book), as the entire process can be represented as a single step in code, greatly reducing the likelihood of manual transcription errors.
In our project with DCMS, we decided to use the R language, however we could equally have chosen to use Python or another language entirely: the techniques we outline below are language agnostic.
Version control
Few software engineers would embark on a new project without using some sort of version control software. Version control software allows us to track the three Ws: Who made Which change, and Why?. Tools like git can be used to track files of any type, but are particularly useful for code in text files for example R or Python code.
Whilst git can be used locally on a single machine, or many networked machines, git can also be hooked up to free cloud services such as GitHub, GitLab, or Bitbucket. Each of these services provides hosting for your version control repository, and makes the code open and easy to share. The entire project we are working on with DCMS can be seen on GitHub.
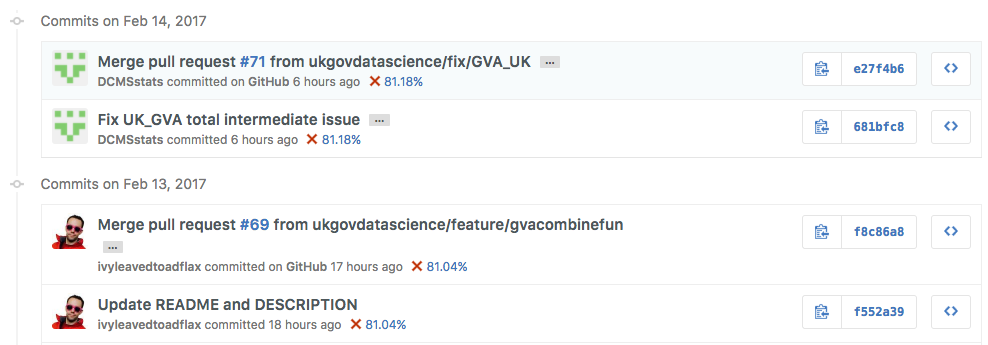
Obviously this won’t be appropriate for all Government projects (and solutions do exist to allow these services to be run within secure systems), but in our work with DCMS, we were able to publish all of our code openly. You can use our code to run an example based on the 2016 publication, but producing the entire publication from end to end would require access to data which is not published openly. Below is a screenshot from the commit history showing collaboration between data scientists in DCMS and GDS. The full page can be seen on GitHub.
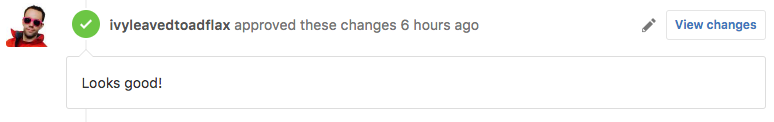
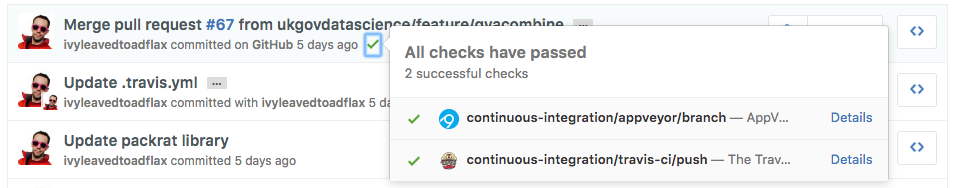
Using a service like GitHub allows us to formalise the system of quality assurance (QA) in an auditable way. We can configure GitHub to require a code review by another person before the update to the code (this is called a pull request) is accepted into the main workstream of the project. You can see this in the screenshot below which relates to a pull request which fixed a minor bug in the prototype. The work to fix it was done by a data scientist at DCMS, and reviewed by a data scientist from GDS.
Packaging Code
One of the difficulties that can arise in the more manual methods of statistics production is that we have many different files relating to many different stages of the process, each of which needs to be documented, and kept up to date. Part of the heavy lifting can be done here with version control as described above, but we can go a step further: we can create a package of code. As Hadley Wickham (author of a number of essential packages for package development) puts it for R:
Packages are the fundamental units of reproducible R code. They include reusable R functions, the documentation that describes how to use them, and sample data.
Since it is a matter of statute that we produce our statistical publications, it is essential that our publications are as reproducible as possible. Packaging up the code can also help with institutional knowledge transfer. Linking the documentation to the code makes everything much easier to understand, and can help to minimising the time taken to bring new team members up to speed.
Procedural programming and unit testing
In procedural programming, code is designed to be reused again and again with different inputs, making for simpler code that is easier to understand and audit. It means we can easily build tests to ensure the code continues to work as expected when we make changes to it.
Since each function or group of functions (unit) is generic, it can be tested with a generic example, so that we know that our unit of code works as expected. If we discover cases where our units do not do perform as expected, we can codify these cases into new tests and work to fix the problem until the test passes. We may even go a step further and adopt the practice of test driven development: starting each unit of code with a test which fails, until we write code which can pass the test.
Much of the heavy lifting for this kind of testing can be done in a unit testing framework, for example testthat for R, or nosetools in Python.
Automated Testing
Once we are in the habit of packaging our code and writing unit tests, we can start to use free online tools such as Travis CI, Jenkins, or Appveyor to automatically test that our package of code builds, and that the tests we have written, pass.
These tools integrate with GitHub, so we can easily see when an update to the code has failed one of our tests. The green ticks in the box below show that our tests have passed for the given pull request.
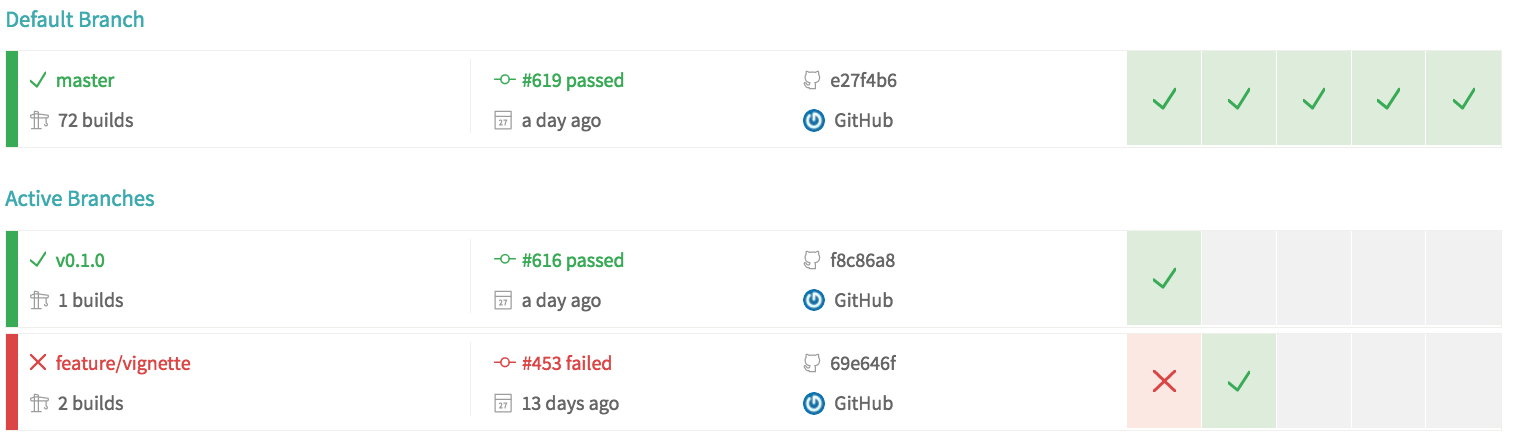
We can also look at our test history on Travis CI, as in the screenshot below. From this we can see that our main workstream - the default branch - has been tested 619 times to date, the last of which was one day ago, and the previous five tests have all passed without problems.
Code coverage
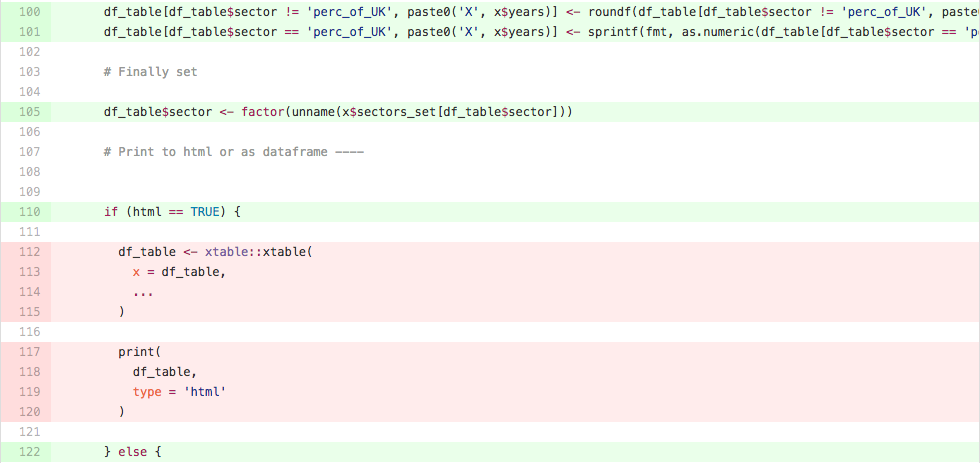
An additional set of tools we can start to use once we begin writing our own tests is code coverage tools, for instance codecov.io, or coveralls.io. These tools are able to analyse the code we have written via hosting services like GitHub, and provide a line by line breakdown of which lines are tested, and which are not. For example, in the lines below from the file year_sector_table.R, we can see that lines 112-115 and 117-120 are not explicitly tested. In this case, we probably don’t need to worry very much, but on other occasions this might prompt us to write more tests.
Dependency management
One of the problems with working with open source software is that it is quite easy to fall into a trap called ‘dependency hell’. Essentially, this occurs when the software we write depends on open source packages, which depend on other open source packages, which can depend on other packages, and on, and on.
All these packages may be written by many different people, and are updated at vastly different timescales. If we fail to take account of this, then we are likely to fail at the first hurdle of reproducibility, and we may find that in a year’s time we are no longer able to reproduce the work that we previously did - or at least not without a lot of trouble. There are several ways we might get on top of this problem, but in this project we opted for using packrat, which creates a cache of all the R packages used in the project which is then version controlled on GitHub. I’ve blogged about this previously in the context of writing academic works.
Testing for issues in the data
All the testing we have described so far is to do with the code, and ensuring that the code does what we expect it to, but because we have written an R package, it’s also very easy for us to institute tests for the consistency of the data at the time the data is loaded.
The list of tests that we might want to run is endless, and the scope of tests very much be dictated by the team which has the expert knowledge of the data. In the eesectors package we implemented two very simple checks, but these could very easily be expanded. The simplest of these is a simple test for outliers: since the data for the economic estimates is longitudinal, i.e. stretching back several years; we are able to look at the most recent values in comparison to the values from previous years. If the latest values lie within a threshold determined statistically from the other values then the data passes, if not a warning is raised.
These kinds of automated tests are repeated every time the data are loaded, reducing the burden of QA, and the scope for human error, freeing up statistician time for identifying more subtle data quality issues which might otherwise go unnoticed.
Producing the publication
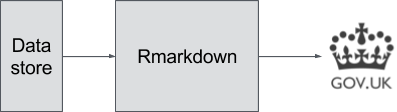
Everything I have talked about so far is to do with the production of the statistics themselves, not preparation of the final publication, but there are tools that can help with this too. In our project with DCMS we plan to use Rmarkdown (a flavour of markdown) to incorporate the R code into the same document as the text of the publication.
Working in this way means that we can do all of the operations in a single file, so we have no problems with ensuring that our tables or figures are synced with the latest version of the text: everything can be produced in a single file. We can even produce templates with boilerplate text like: ‘this measure increased by X%’, and then automatically populate the X with the correct values when we run the code.
Getting the balance right
Whilst incredibly powerful, these approaches should not be seen as panacea for all the difficulties of statistics production: however, implementing even a few of these techniques can drive benefits in auditability, speed, quality, and knowledge transfer. There is a balance to be struck between ease of maintenance and the level of automation: this is likely to differ for every publication or team. These techniques are however tried and tested for software development and most already feature in the Service Manual: in this project we have just applied these methodologies to a new area.
In this project we aimed at a high level of automation to demonstrate what is possible, and because DCMS have a skilled data scientist on hand to maintain and develop the project. Nonetheless, in the course of this work, statisticians at DCMS have undertaken training in R, and we have spent time to ensure that the software development practices such as version control, unit testing, and continuous integration are embedded within the team that owns the publication.
We’re continuing to support DCMS in the development of this prototype pipeline, with the expectation that it will be used operationally in 2017. If you want to learn more about this project, the source code for the eesectors R package is maintained on GitHub.com. The README provides instructions on how to test the package using the openly published data from the 2016 publication. Please get in touch if you would like advice on developing a pipeline within your department.
Matt Upson is a Data Scientist at GDS.

3 comments
Comment by Sergio Bacelar posted on
Where I work we use MsWord revisions to prepare the final statistical paper for publication. How could it be done with RMarkdown?
Comment by Mat Gregory posted on
Sergio, you can output as MsWord. Various output formats are supported.
https://rmarkdown.rstudio.com/word_document_format.html
Comment by George Simpson posted on
great article, Matt - these disciplines are important not just in this context, but in business generally. They offer the competitive advantages of reduced costs and improved quality, for relatively small investment.
There is an analogy between businesses in competition and athletes training for competition that I sometimes use in talking about this area. "Are you willing to discipline yourself to gain a chance of winning?"