We’ve recently invited another round of applications to the Data Science Accelerator Programme. This blog gives you a taster of what that involves. It covers recent Accelerator projects and our latest Data Science Show and Tell (where 2 of these projects were featured).
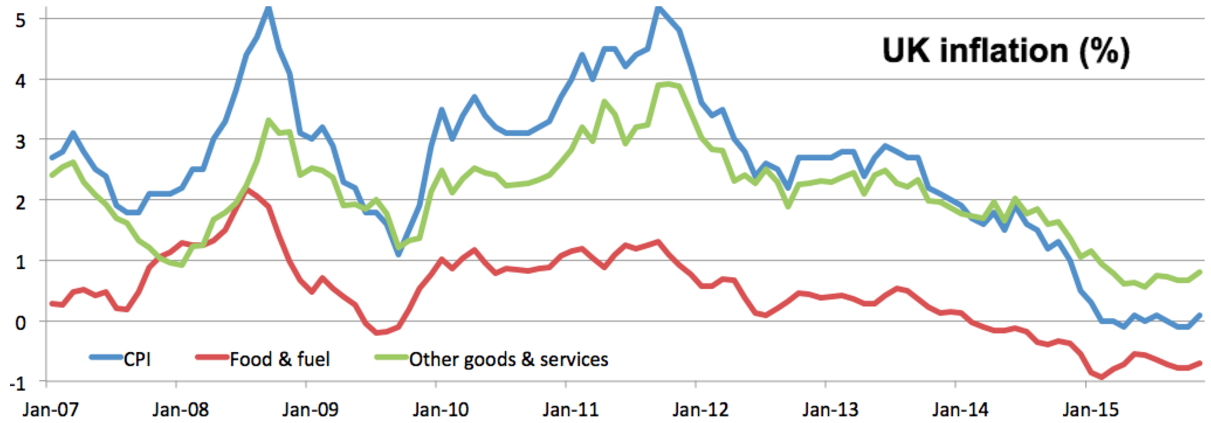
The Office for National Statistics (ONS) has an exploratory project to scrape prices from shopping websites to measure inflation. But what happens when a website slightly changes their products from one month to the next (or a product just isn’t available)? Dropping all these products from an inflation measure would leave out a lot of data. Liz Metcalfe (ONS) used clustering to make progress on this problem (i.e. finding groups of products that are very similar to each other). It really matters, because a lot depends on good inflation statistics - from pensions to how much of our tax is spent paying interest on government debt.
Tax Agents are one of the biggest groups HM Revenue and Customs (HMRC) interacts with, and as a key point of contact with taxpayers can help deliver better public services more cheaply. Ben Daniels (HMRC) has shown how Data Science can improve knowledge of this group by collecting key information from agent’s public websites, and delivering this in a structured form through an interactive Web App.
By carrying out user research with his business sponsor highlighted the importance of obtaining web data in a clearly legal way,and Ben explored several approaches to extracting data from search engines, writing several custom scrapers in python including one for DuckDuckGo.
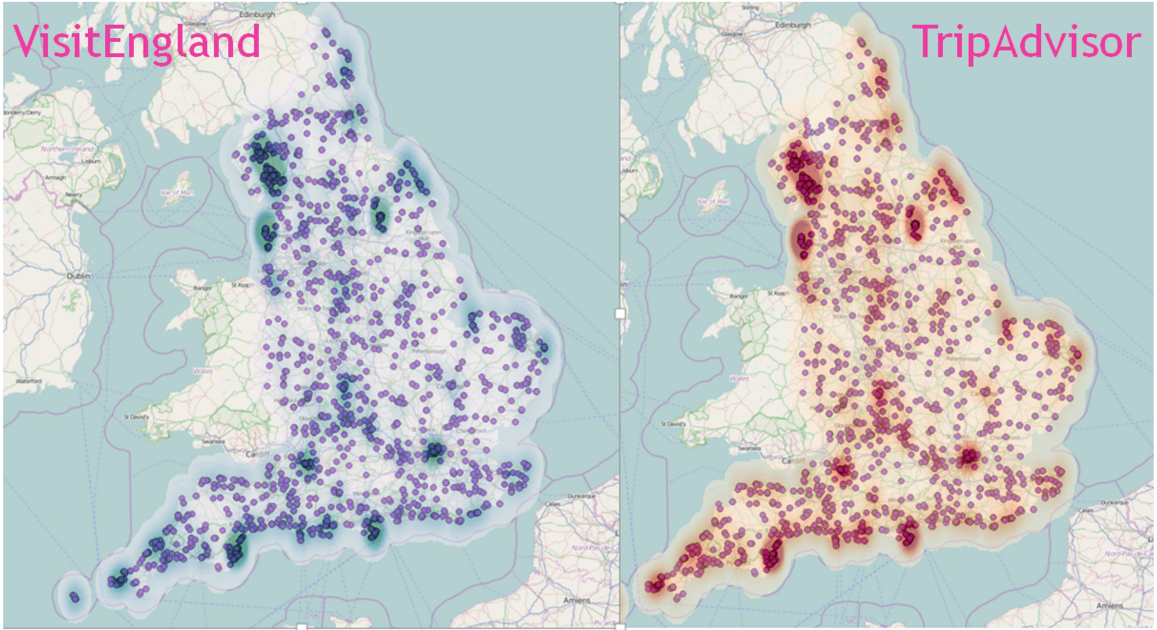
Sabine Gerdon from the Department of Culture, Media and Sport (DCMS) compared Visit England star ratings for hotels and B&Bs with TripAdvisor scores (thank you to TripAdvisor for sharing a data extract). She had to overcome several obstacles due to data availability and quality. Sabine found that although TripAdvisor and VisitEngland use different criteria and ways to assess quality, the rating outcome is very similar and they are very close to being substitutes. The map shows the accommodations in her data set across England and the darker the shading the higher is the score on TripAdvisor and VisitEngland respectively.
Tom Irving (HMRC) looked at whether publicly available data, including from the Companies House new beta service, could be used to help predict insolvency. This would help HMRC understand the potential future impact on tax paid to government if companies were showing financial stress. He identified several factors that are connected to an increase in the probability of a company becoming insolvent.
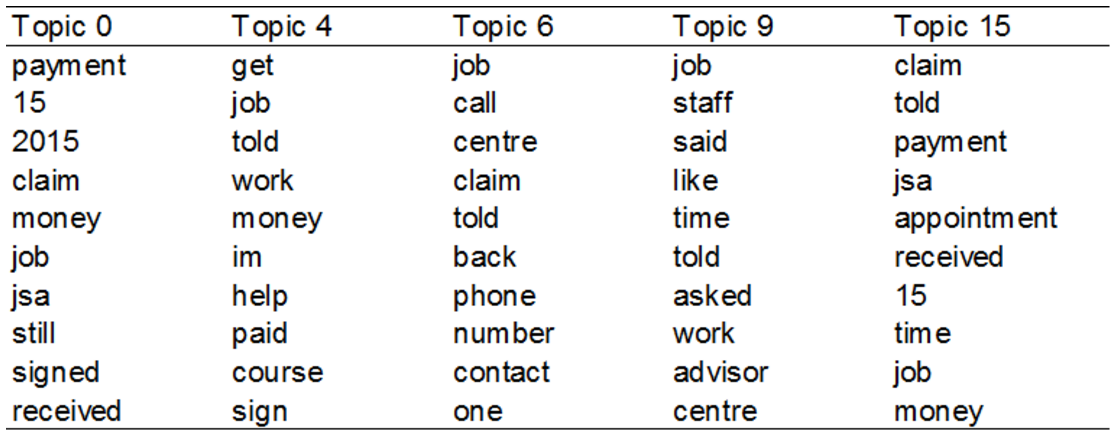
Weichao Wang at the Department for Work and Pensions (DWP) used text analysis improve understanding of complaints to DWP through their JobCentre Plus services and how the department could reduce them. The topic modelling techniques created word groups that allowed for complaints to be automatically tagged and each topic used for qualitative analysis. Combined with data shared by the user, the project can reduce large quantities of text into manageable and categorised chunks for research purposes. The table shows a sample of topics and related keywords from the analysis.
Jonathan Edwards and Richard Allison (DfE) looked at predicting participation in post-16 education. This is important for their department as a better understanding can help further develop and expand DfE’s ability to plan future budgets and support its policymakers. They used decision trees and random forests to rank the key factors associated with whether a young person participated, or not, in further education at academic age 16.
Data Science outside government
Stephen Harrison (Principal Software Engineer, British Gas) briefed us on how British Gas developed their data science function. Prototyping for a data lake began in 2013 with a toy Hadoop cluster based on Raspberry Pis. They now have an enterprise scale Hadoop cluster and use SAS and Revolution R as their analytical toolset.
Stephen explained that their approach to data science was to use multi-disciplinary teams because in practice it is very hard to find individuals who are good at all data science skills (software development, statistics, domain knowledge, etc.). Projects typically last about 4 weeks each and are managed in an agile way (using a mixture of Scrum and Kanban). This works well for most projects, although some don’t need the full team (e.g. Twitter analysis often doesn’t need a developer - it can be done by a statistician who knows Python working with someone who understands the business).
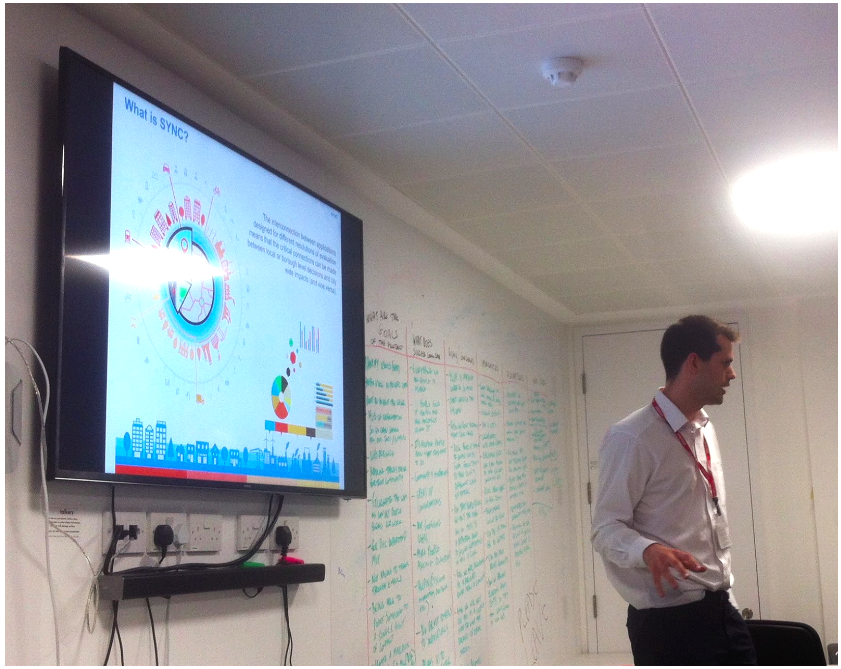
Finally, Pete Ferguson talked about the Centre for Advanced Spatial Analysis (CASA) at University College London. They have worked with partners from both public and private sectors to develop the idea of synergistic cities (SYNC). This gives people planning different aspects of a city (housing, transport, power, etc.) an online model of how changes to one aspect of a city affect everything else. For example, if more homes were built in a particular area, would transport pricing and subsidies also need to change to keep the city running smoothly?
Over to you…
Please get in touch if you’re interested in the Data Science Accelerator or our regular Show and Tells (the next is in March).

3 comments
Comment by John Carney posted on
This is very interesting, is any of the code available online for perusal?
Comment by Guy Smith posted on
Hi David
How do we get in contact to register our interest?
Many thanks
Comment by David Wilks posted on
Please email: david.wilks@digital.cabinet-office.gov.uk