A few months ago I was asked by some of our users to explain what the GDS Internal IT team does and how we add value. So began my journey to create something to try and show it. This Performance Platform dashboard is the outcome.
Not everyone knows that our team manages many things. For example, we're responsible for the GitHub, Google Analytics and Google Enterprise accounts; the internet, PSN and WiFi connections in Aviation House; and all of the IT and voice hardware for GDS.
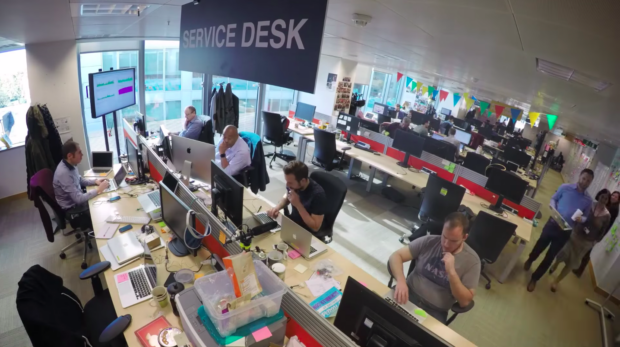
Service Desk
Some in GDS will know the good reputation the Service Desk team has for being positive, proactive and creative. I wanted to capture the often missed feedback that goes their way and share this more widely.
Daz on the Service Desk quickly grasped what we needed. He created a simple survey using Survey Monkey to capture the level of our user’s satisfaction at the point of their getting help. Realising there was a more suitable product, he quickly redesigned the survey using TypeForm. So now when staff call at the Service Desk for help, they can quickly provide their feedback through an iPad.
The information from these surveys is now combined with responses to a parallel survey, designed by Jacob, which is sent as an automatic email through our WebHelpDesk ticketing system.
Network team
The Network team already produce a detailed monthly capacity report, so I now extract the key elements to show how the network is being managed in terms of traffic volumes, intrusion prevention and availability.
Creating the dashboard
I was able to create an alpha dashboard, combining all this information using simple charts in Google. This quickly morphed into a beta on the Performance Platform following user feedback.
After a final round of feedback and inputting live data, the Dashboard is now firmly positioned as a tool to help answer some of those earlier questions. It's also a great conversation piece when people stop by at the Service Desk and see the dashboard as a live display.
Please have a look at the dashboard and let me know what you think - we always want to keep improving.
When you have a moment, also have a look at the videos created by my two teams as these help to explain a little more of what we do.
Video: Meet the GDS internal IT service desk team
Video: Meet the IT network team
Follow Richard on Linked In, and don’t forget to sign up for email alerts.