The Performance Platform is helping build experimental visualisations for the London Fire Brigade (LFB) to let you view and query data on call-outs, such as emergency response times, and the number of fire incidents per London ward. This work is part of our prototypes project, where we are testing new approaches to data analysis and visualisation.
For this particular prototype, we worked with the Department for Communities and Local Government (DCLG), who are responsible for the system that logs details regarding fire brigade call-outs.
Open fire data
Before testing ideas, it’s often useful to look at existing open datasets that achieve balance between data confidentiality and data granularity. The London Fire Brigade (LFB) publish data on data.london.gov.uk, achieving this balance, and allowing analysis to be done at a ward level. This was particularly convenient for our analysis.
The DCLG log data showed the LFB receive approximately 250,000 calls per year with around 120,000 of these requiring attention from fire engines. However, the ability to interactively query this data ratio and discover patterns over extended time periods was not possible, so we decided this would be our focus for creating a new visual prototype.

The screenshot above shows a visualisation from our first work with the LFB data. A link to the live version can be found on the prototypes page.
A dashboard of sorts
The underlying hosting and back-end infrastructure of this prototype is similar to that of the river levels visualisation dashboard that I've blogged about already. It uses Flask to handle the server-side requests and URL routing and Heroku as the cloud platform. In this example we make use of Twitter Bootstrap to handle styling, layout consistency and responsive design. The interactive choropleth holds ward and borough aggregates, as well as additional data ranging from response times to daily breakdowns. The main strengths of this design are its:
- interactivity
- efficient SQL-style querying
- interconnections with other charts
In combination, this gives a dynamic platform to query datasets of significant size in a browser. The creation of the choropleth relies heavily on three excellent open-source JavaScript libraries:
- d3.js - that manipulates documents based on data
- Crossfilter - a highly efficient multivariate data exploration tool
- dc.js - provides multi-dimensional charting
These libraries massively simplify the process of interrogating unwieldy datasets. Similarly, the responsive visuals and incorporation of geospatial representations naturally highlight interesting patterns that are otherwise difficult to see in flat, CSV formats.
Reading the data
Consider this choropleth, which shows the number of malicious false alarms logged by DCLG.
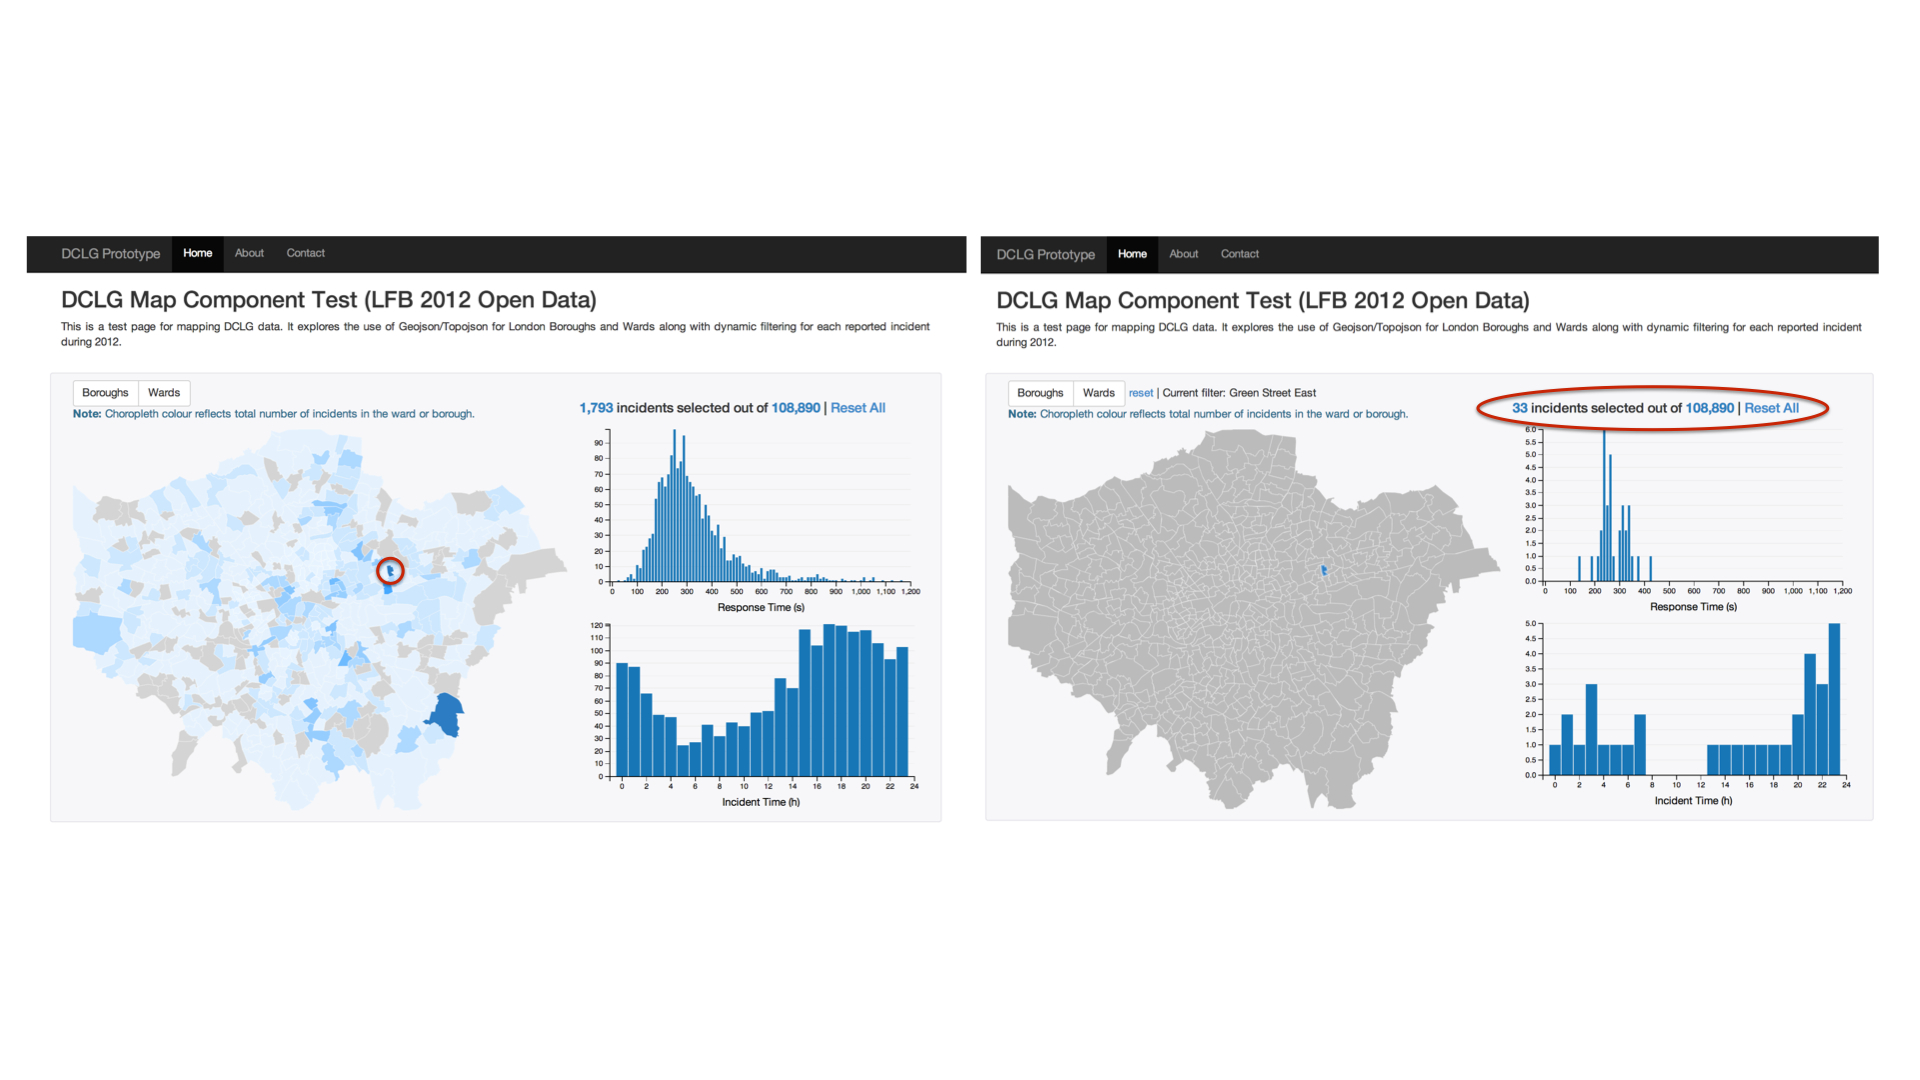
You'll see that there are a couple of wards that are outliers in this category, shown by their colour, which marks them out as having higher than average incident numbers. One of these wards is Green Street East. If you click on this ward, then deselect the incident type filter, it shows false alarms to be approximately 25% of total call-outs. This is potentially worth investigating.
Next steps and limitations
It would be straightforward to extend this platform to multiyear data, which would allow more accurate conclusions to be made regarding outliers and seasonal variations. In addition, the ability to compare and contrast local and nationwide fire authorities, and communicate their performance against set targets would greatly extend the platform's functionality.
One limitation of this data explorer lies in the limited browser compatibility. Internet Explorer 8 and below do not support SVG graphics, meaning none of these charts will be rendered in these browsers. This creates issues across many government departments due to the prevalence of these legacy browsers. However this tool was built as an example of what is possible when unconstrained by fundamentally simple IT limitations.

1 comment
Comment by Contemporary stairs posted on
I'm no longer sure where you're getting your info, but great topic.
I needs to spend a while finding out much more or understanding more.
Thanks for fantastic information I was in search of this information for my mission.