News articles account for a lot of the traffic to GOV.UK, getting approximately 225,000 visits in a typical week. But until now, we haven’t had the opportunity to conduct a deeper analysis of them. How fast do their viewing figures fall? Is behaviour consistent across all content we brand as ‘news’? What are the outliers, and how do they behave?
We focused our analysis on a typical six week period during August and September, when approximately 600 news articles were published on GOV.UK. For consistency, we looked at daily unique pageviews (UPVs) across each article, with information on publication dates and times scraped from the html of the pages themselves. All of the processing and analysis was performed in Python, using several of the numerical computation modules that are available.
How news behaves
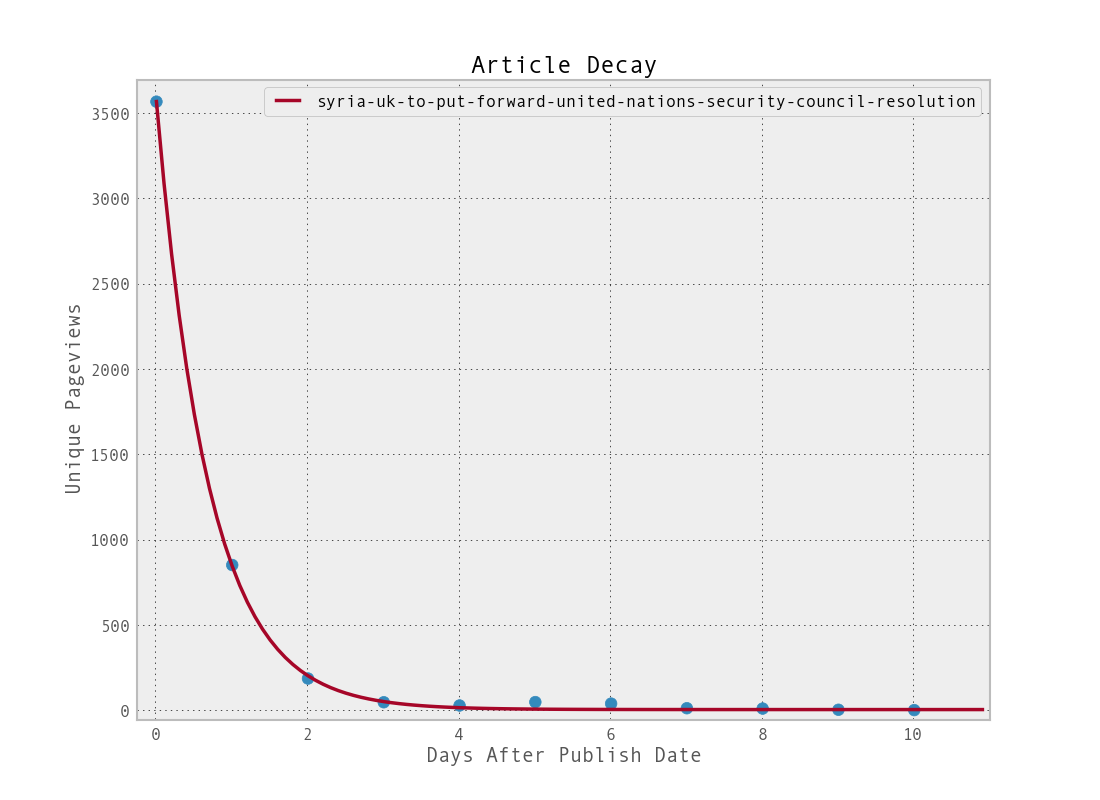
We started with the chip shop assumption - that today’s news is wrapping tomorrow’s fish and chips. News articles are typically short lived with a rapid decline in audience interest. The question is whether this decline is analogous to radioactive decay; a series of individual random events that follow a predictable long-term pattern. With that comparison in mind, we took a simplified exponential decay model approach to represent the fall in unique pageviews over time.
In order to avoid ‘over-fitting’ the model to limited data, the news articles were filtered to include only those that had at least eight days worth of data and more than twenty unique views on its most popular day. This left us with approximately 500 articles. We then wrote a script which looped over these and attempted to fit an exponential decay to the unique pageview data. If successful, the decay constant (a measure of how quickly the number of unique pageviews decreases) was extracted and used to calculate the time it takes for the article’s traffic to drop to 10% of its initial value. The plot below shows an example of an article accurately described by the exponential model.
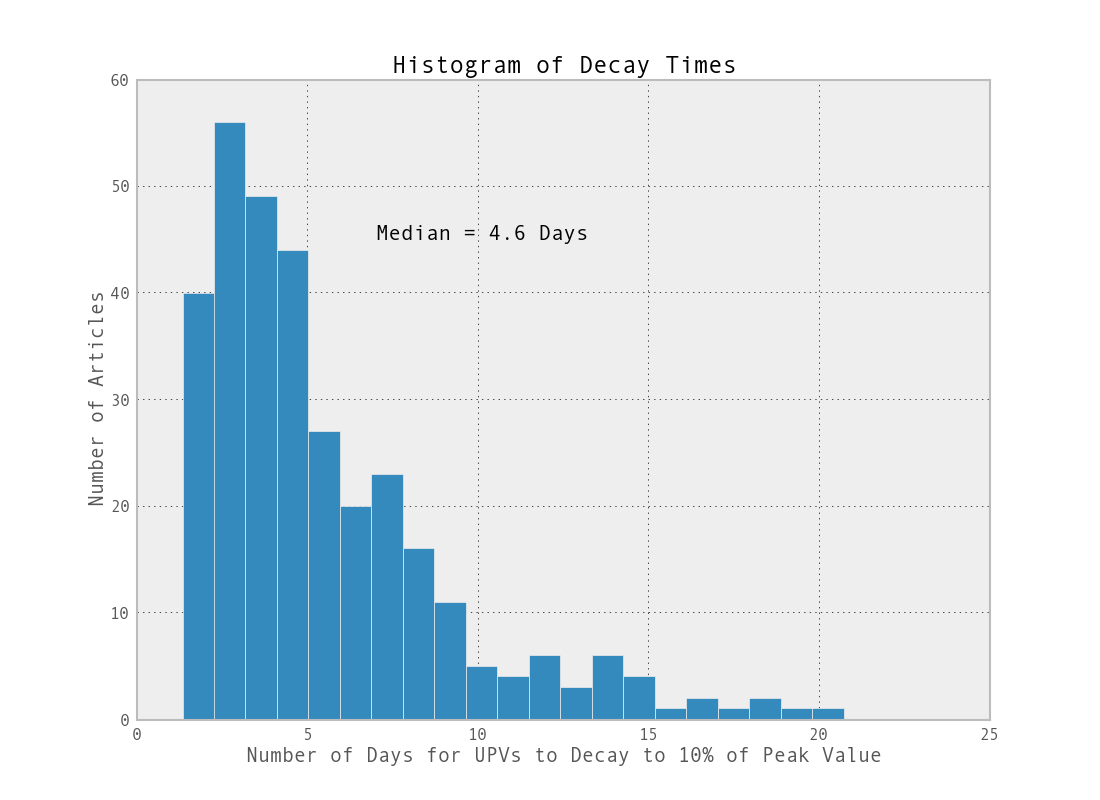
Of the 500 or so articles that were processed, around 70% could be fitted in this fashion with varying degrees of accuracy. This is the distribution across the full sample.
Outliers
Some articles did not conform to this pattern of early peak followed by a pronounced drop-off.
There are several possible reasons for this:
-
Some articles may contain useful information that needs to be referenced periodically.
-
Referring links can sometimes drive traffic to articles after the publish date leading to spikes which do not agree with the above decay.
- Some articles published on Friday, Saturday or Sunday will not receive representative traffic until Monday or Tuesday - reflecting the GOV.UK drop in unique pageviews during the weekend.
Does publication date matter?
The effect of a publication date on an article’s unique pageviews is one worth knowing. Clearly, the government is not going to publish all of its news on a particular day just because it happens to be the most popular. But knowing that particular days are more popular than others might be useful knowledge for things like campaigns, for example. In a brief exploratory analysis, we looked at all news articles that received views (not just those that were published) during a six week window.
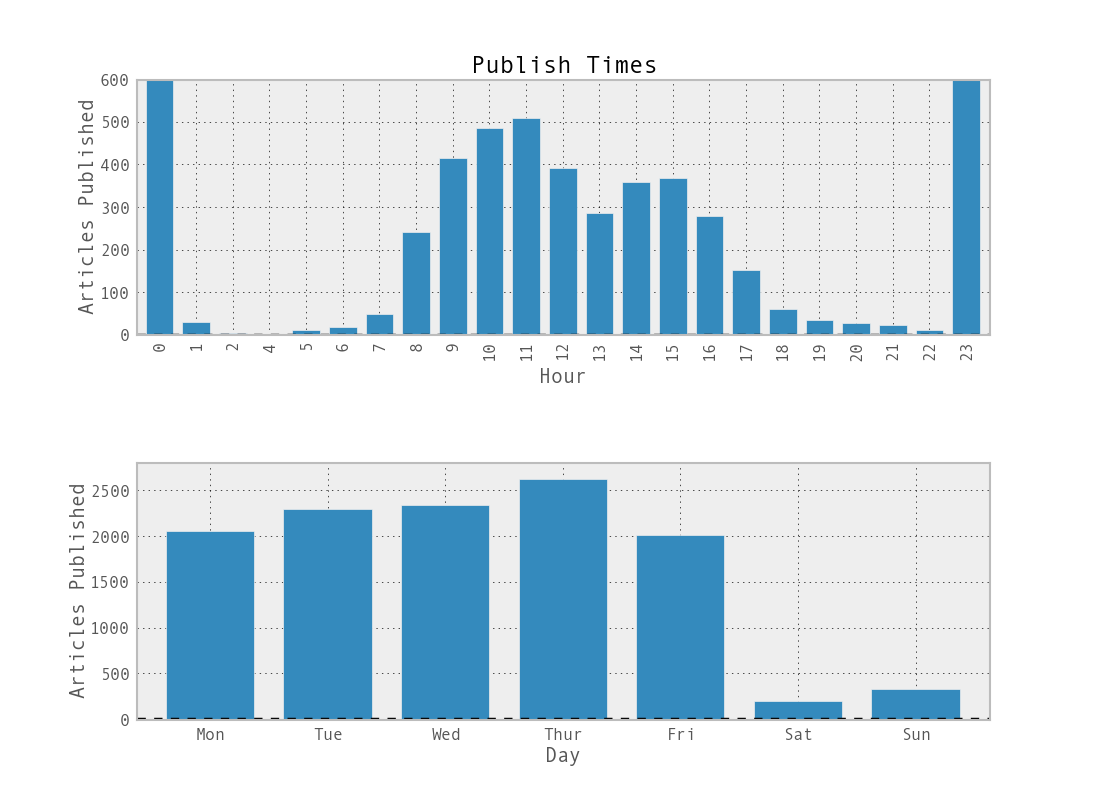
The first thing to mention about the hour breakdown is that the scale actually cuts off the values for 23:00 and 24:00 which account for just over two-thirds of all 12,000 article publication times. This is not particularly surprising as these are the most likely automatic push times for articles due to go out on a particular day. The distribution during the working day nicely reflects the split between pre and post-lunch with the dominant peak occurring around late morning.
The overall pattern of the day-of-week data also rings true, with weekdays massively outweighing weekends. What may be slightly more surprising is the position of Thursday as the most popular. Relating this back to the observation that content published on Fridays often has a different pattern of unique pageviews, it would be useful to quantify this and assess the effect it could have from a communication point of view. Are the right people finding these articles or are they being potentially lost?
We are continuing our research in to news over the next few weeks, so let us know if you have any suggestions for us to investigate.

4 comments
Comment by Patrick Druggan posted on
Interesting piece. Have you published the findings in a peer-reviewed journal? I'm working on infomation half-life in a completely different field, and it would be good to be able to cite this.
Comment by Ed Ridout posted on
Interesting blog, thanks GDS. I'm curious about the relationship between pageviews and time of publication. Our (DCLG's) least pageviewed news stories are often the ones that go out later in the day for obvious reasons. We hardly ever publish at midnight during the week so I'd be interested to hear if there are any pageview advantages in doing this. Is there an optimum time in the day to publish anything on gov.uk in terms of how many views it gets?
Comment by Annelise Jespersen posted on
This is very interesting and will help us with some research we are doing on news articles at DH. Do you - or are you able to - make any distinction between press releases and news stories?
Comment by Graham Francis posted on
Hi Annelise - we can't do this right now, but it's definitely one of the things we could look into doing to get further insight. G